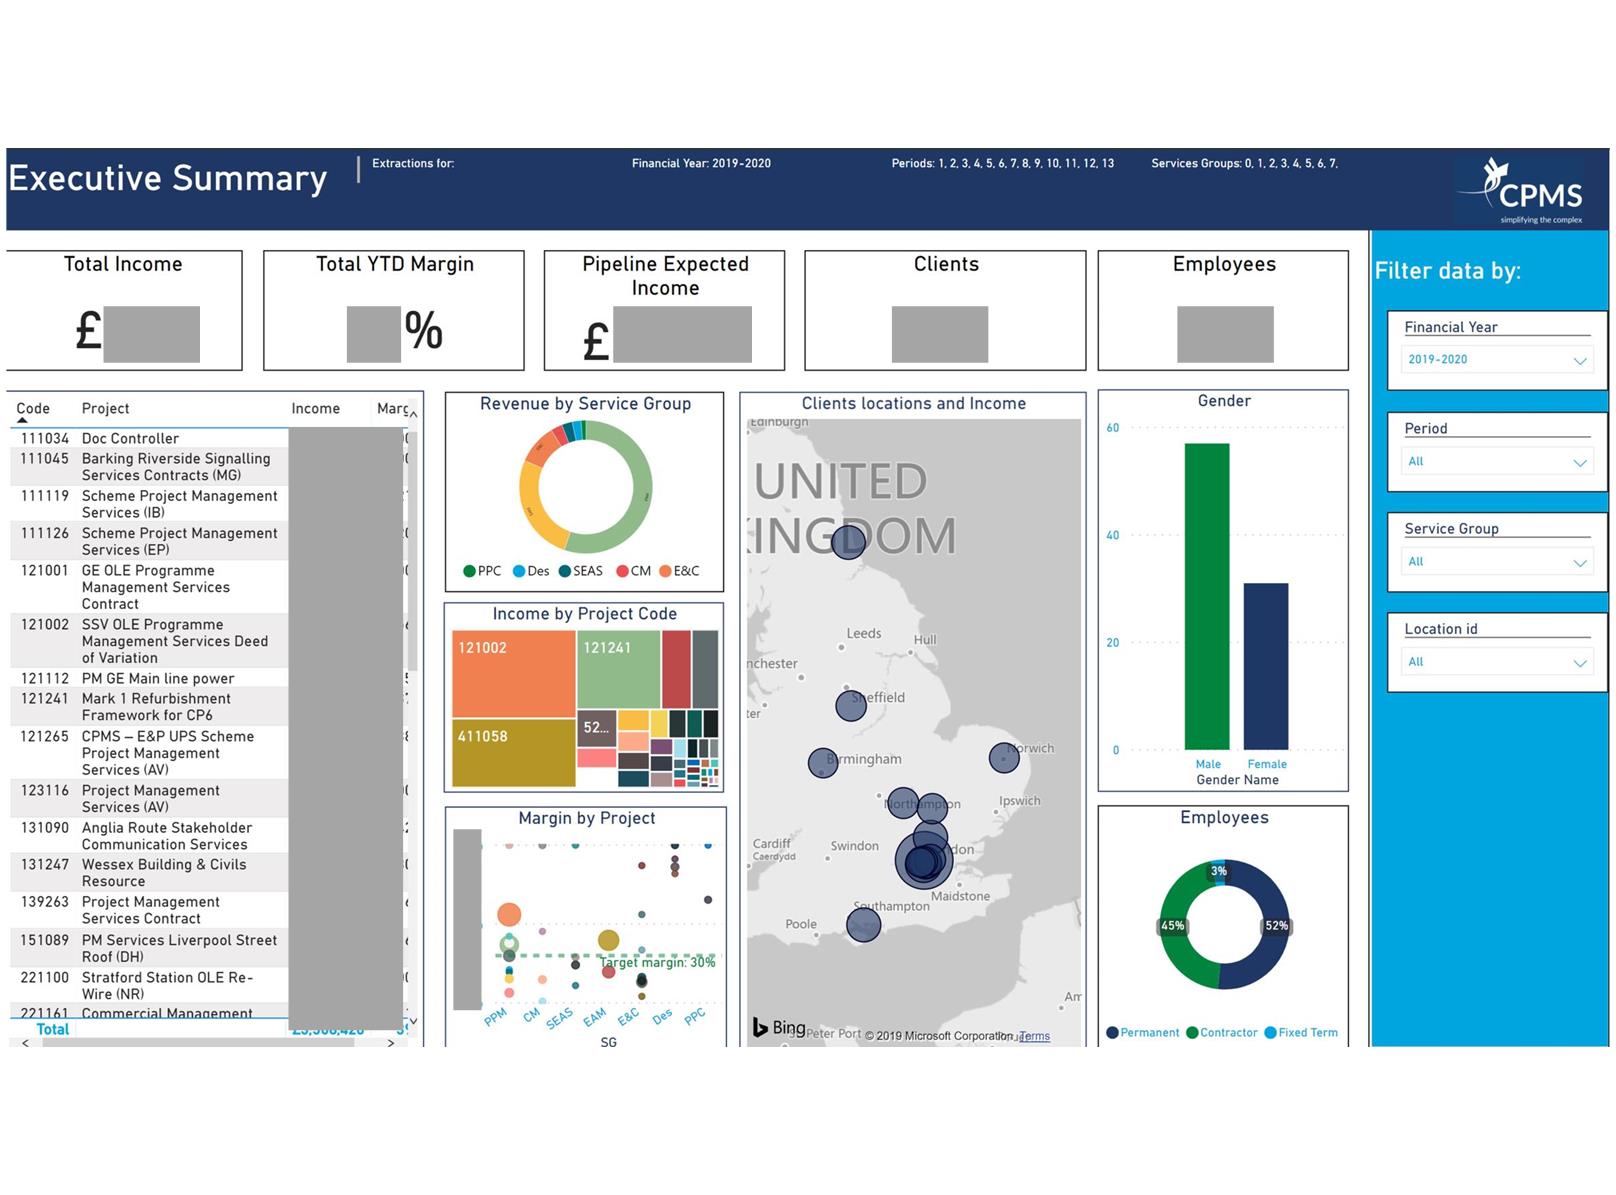
KPI Dashboard
Client:
Sector:
Data visualisation and process automation.
The context:
CPMS (Collaborative Project Management Services) manages hundreds of projects for rail industry clients in the UK and abroad. The team is growing bigger as the number of projects and the needs to analyse and communicate the staff availability, budget forecast and other company KPI to the management team and the shareholders.
What we did:
We collected useful company data from its different sectors (finance, HR, marketing etc.) and set up an online dashboard enabling the visualisation of this data using Power BI. We then developed a fully automated process so any new data regarding new projects, staff, pipeline, forecast etc. would be updated on the dashboard and immediately available for query and visualisation to all the stakeholders.
The value for our client:
This automated dashboard saves several days of work every month. The time to collect, format, sort, compute the data is now a question of seconds when it used to be a matter of days. Besides, the communication is no longer polluted by superseded spreadsheets or pdf reports stored in mailboxes or local folders. All the information is clean and always up to date in one single secured webpage, always available to the management team and the company shareholders.