Web platform for traffic count data analysis and visualisation
Partners:
Sector:
Data processing and web development
The context:
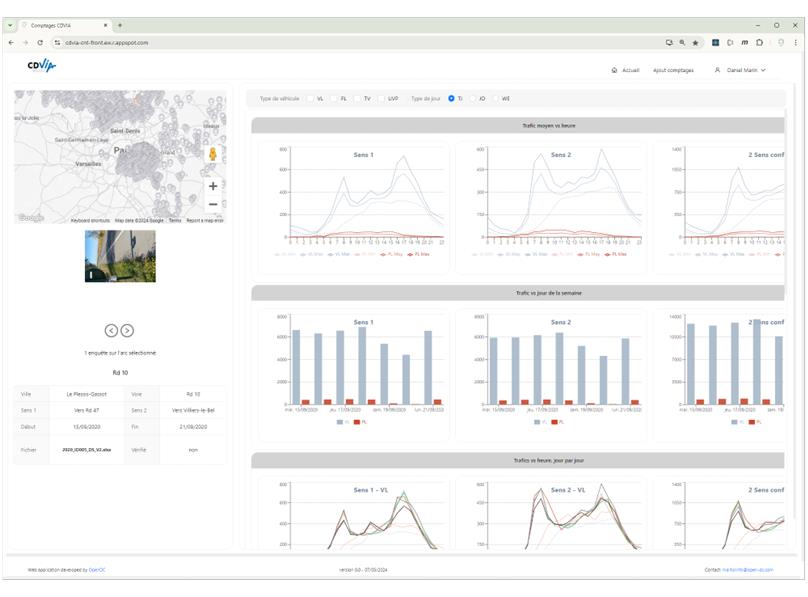
Our client has been collecting traffic count data for the past 30 years in the Paris region and across France. This invaluable data source is spread across hundreds of thousands of files, making it cumbersome to locate historical data for a given location on the road network. They approached OpenDC for assistance in consolidating and structuring this data and enabling access through a secure web platform
What we did:
We developed a process to extract the data from multiple files and structured it into a unified database. Additionally, we created a web application and an API to secure access to the platform, enable ingestion of new data from local files, and provide intuitive and seamless data visualisation and analysis through the platform’s user interface. The front-end was developed with React.js, the API and back-end with Flask. The Prophet library for time series analysis was used to detect and correct inconsistencies in the count data.
The value for our client:
Our client now has easy access to their data for developing models and conducting analyses. They can also grant access to the platform to their end clients, allowing them to retrieve traffic count data they have purchased. This eliminates the risk of data loss caused by individuals leaving the organisation and taking with them knowledge about the data’s storage locations.